Agency
Manage All Your Workspaces in One View
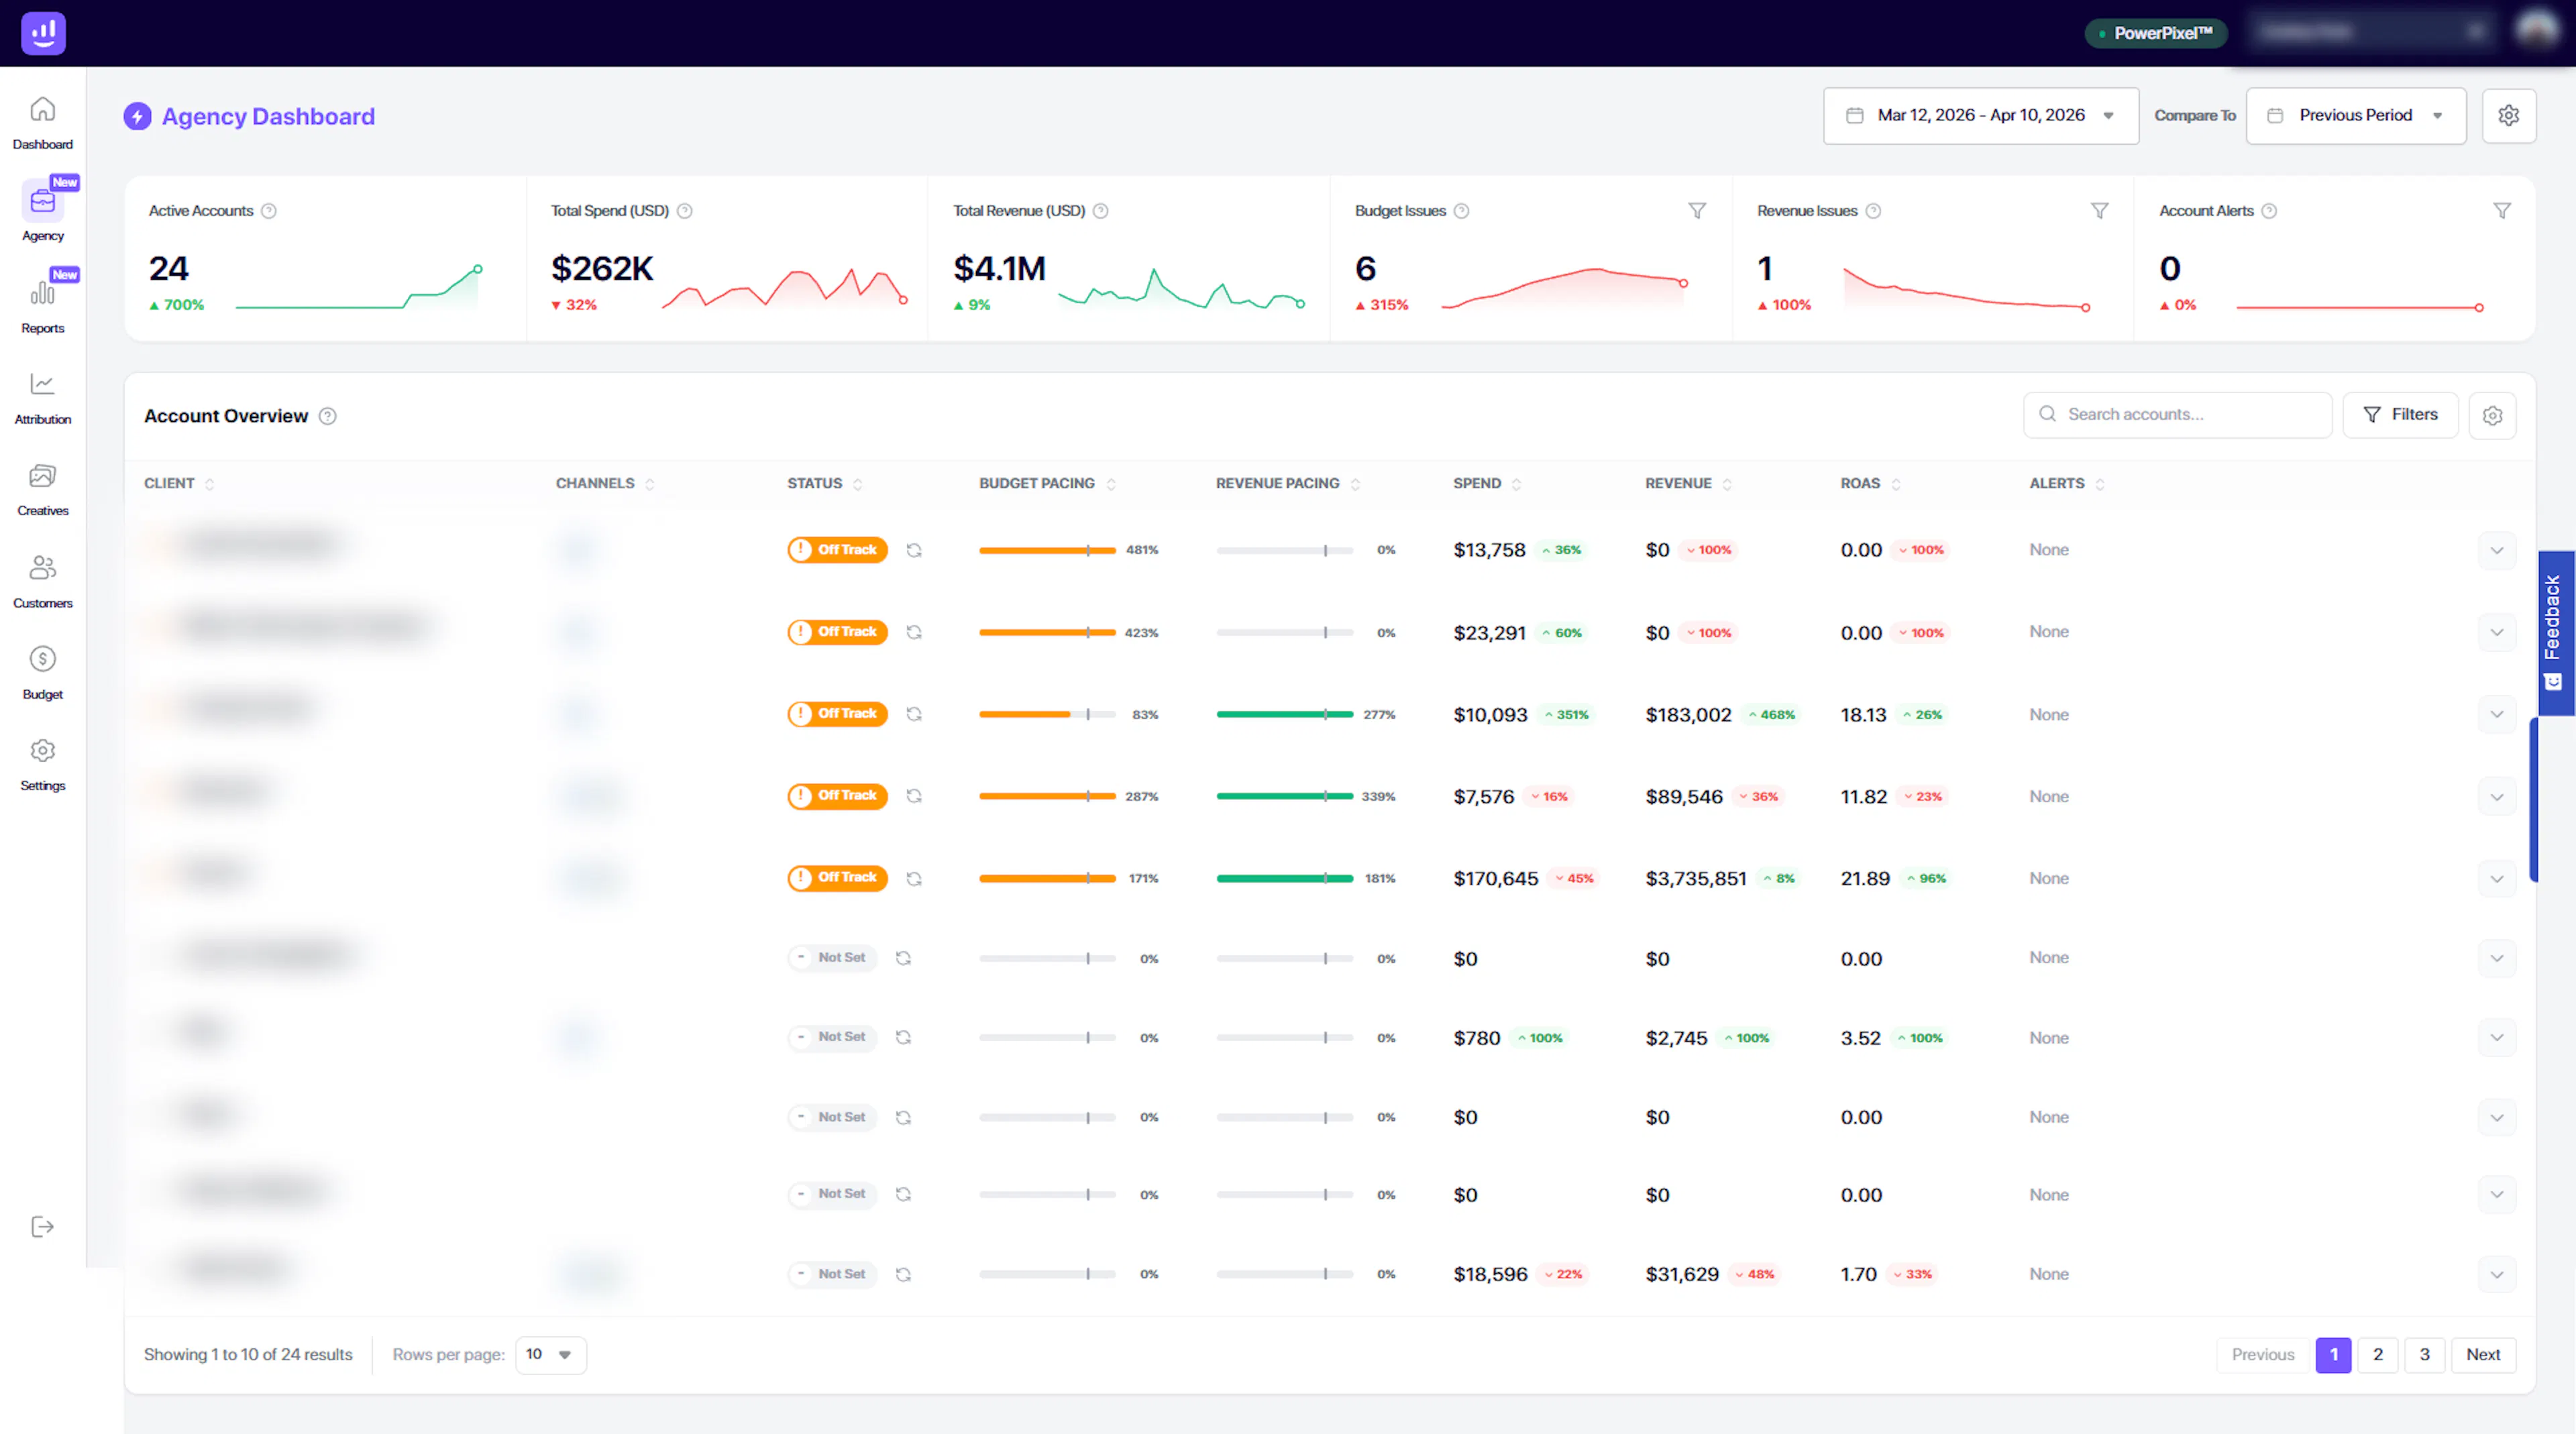
The Agency Dashboard gives you a high-level overview of all your workspaces in a single, centralized page.
If you manage multiple stores, brands, or clients, this is your command center to quickly monitor performance, identify issues, and take action across all accounts.
What You Can Do with the Agency Dashboard
01. Get an Instant Overview of All Workspaces
View all your active workspaces in one place.
Quickly understand:
-
Overall marketing performance
-
Which workspaces are performing well
-
Which ones need attention
This allows you to stay on top of multiple businesses without switching between accounts.
02. Track Key Metrics at a Glance
At the top of the page, you’ll find aggregated metrics across all workspaces, including:
-
Total number of active workspaces
-
Total ad spend
-
Total revenue
-
Workspaces with budget pacing issues
-
Workspaces with revenue pacing issues
-
Workspaces with critical alerts or connectivity issues
These summary metrics help you instantly assess the overall health of your portfolio.
03. Analyze Workspace-Level Performance
The main table displays all active workspaces, with each row representing a single workspace.
You can view key metrics such as:
-
Status
-
Ad spend
-
Revenue
-
ROAS
-
Budget pacing
-
Revenue pacing
-
Alerts and issues
This makes it easy to compare performance across all your workspaces and identify outliers.
04. Expand for Platform-Level Insights
Click on any workspace to expand it and view a detailed breakdown by platform (e.g., Meta, Google Ads).
This allows you to:
-
Understand which platform is driving results
-
Identify underperforming channels
-
Take targeted action at the platform level
05. Customize Your Table View
Tailor the table to match how you analyze performance.
-
Add or remove metrics using the settings (gear icon)
-
Reorder columns based on priority
-
Focus only on the data that matters to you
06. Search, Filter, and Navigate Easily
Quickly find and manage workspaces with built-in tools:
-
Search – Locate specific workspaces instantly
-
Filters – Segment workspaces based on performance or status
-
Pagination & rows per page – Control how much data you view at once
07. Analyze Data Across Time Periods
Use the date selector in the top-right corner to:
-
View performance for any custom date range
-
Compare current data with a previous period
This helps you track trends, measure growth, and evaluate performance changes over time.
08. Manage Dashboard Settings
Access Agency Dashboard Settings (gear icon in the top-right) to:
-
Include or exclude specific workspaces
-
Customize how workspaces are displayed
-
Sort workspace order for easier monitoring
How It Works
-
Open the Agency Dashboard
-
Review top-level metrics for a quick health check
-
Scan the workspace table for performance insights
-
Expand a workspace for platform-level details
-
Use filters and customization to focus your analysis
-
Take action based on insights and alerts
Why It Matters
The Agency Dashboard eliminates the need to check each workspace individually.
With Growify, you can:
-
Monitor multiple businesses in seconds
-
Identify underperforming workspaces instantly
-
Detect issues before they impact performance
-
Make faster, more informed decisions at scale
Pro Tip
Use the Agency Dashboard as your daily control panel:
-
Start your day here to scan performance
-
Focus on workspaces with alerts or pacing issues
-
Drill down only when deeper analysis is needed